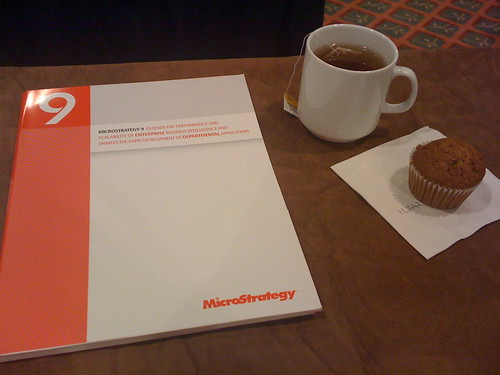
After reading this article about how to present while people are twittering, I thought it would be fun to have the iPhone out and a-twittering during today’s MicroStrategy Roadshow in Cleveland. Alas, it seems that I still scribble physical notes faster than I can type on my iPhone. So, instead of live-tweeting the roadshow presentations, I opted to take notes for later publication instead.
If you’re interested in Business Intelligence software and would like to know what I thought of the new features in MicroStrategy 9, read on. Otherwise, just know that I got up excessively early, learned a lot, and got excited about an updated product for my work.
[Update: in response to a reader’s comment, I’ve expounded on a couple of new features of MicroStrategy 9: Personalized Prompt Answers and the new Graph Report Designer.]

So as not to steal any of MicroStrategy’s thunder, I’ll refrain from going into detail about the details of the new features themselves, and focus instead on which features seemed like they’d be the most helpful to me and my company.
In order of presentation, here are the notes I made. I had originally intended to expound on all of these, or at least include some required explanatory notes to go with them — but in the interest of getting this posted in a timely fashion, I’ll forgo the in-depth analyses and just post my scribbles straight-up: something like I might have Twittered, had I been fleet-fingered enough.
- Faster execution w/ fewer SQL passes
- Portal Integration prebuilt
(We’ve been working toward more seamless integration of reports into our SharePoint portal for some time now, and the sticking points with management against just embedding native MicroStrategy reports via iFrames involve both performance and fluid layout. I’ll be curious to see what comes prebuilt with 9.)
- Web Customization without clunky SDK manipulations
- Users can load prompt answers instead of reanswering every time
- Can edit graphs without going to grid view first. Not hindered by grid layout.
- I agree – you shouldn’t have to train your users to use a dashboard. If you can navigate a webpage, you can use a dashboard.
- Making a dashboard looks like making a powerpoint.
- Incorporate external site in dashboard. Could use HTML container for [other reporting application] or for drilling.
- OnAlert distribution services:
Can send a different report – maybe use leading metrics here?
Can set up users at security level.
Narrowcast will receive Distribution Services licenses. - Change journal – will work best if people use comments.
Would also only work if more than the admin is developing. - Centralized vs. Dept. Admin – not sure how well this would work for us.
- Update package – potential here. Will have to see how we’ll use it.
- Enterprise Manager – tracks prompt answers
- Command Manager – new procedural script with looping, etc.
- Multisource ROLAP – many database sources.
—Ooh, Multisource is a separate product, with a separate charge, like Distribution Services. - New MSTR Architect FTW!
If I decide to create a quasi-professional portion of my blog, or if someone has a specific question about what I meant in one of my cryptic notes, I might expound on these in the future. As it is, though, my blog is mainly a personal one, and one year in BI does not a qualified reviewer make.
Update:
Reader Kranthikumar requested that I explain the graph report designer and personalized prompt answers. It will probably be easiest if I quote MicroStrategy directly before going into my own thoughts:
- New Graph Report Designer — Interactively build graph reports with dozens of visualization options using a new and intuitive graph design tool that makes it easier for designers to visualize the final output of their graphs. Drag and drop elements into metrics, categories, and series zones; use right-click options to quickly format graph elements; and quickly apply a variety of colors and styles to graphs.
- Personalized Prompt Answers — Store personalized answers for a prompt and reuse them wherever the prompt is present, saving time and ensuring efficient prompt handling while running documents and reports.
In MicroStrategy 8, the layout of the graph is very much dependent on the layout of its companion grid. Categories are associated with one place in the grid, series are another, and the Y-axis is another. In the new Graph Report Designer, it’s much easier and more intuitive to add and remove graph elements; a graphical drag-and-drop interface is a vast improvement over having to remember where to put an attribute to make it show up as a series rather than a category on the X-axis. As a designer of dashboards, this will be a HUGE improvement to my workflow.
As far as the Personalized Prompt Answers are concerned, it remains to be seen how helpful these will be in particular situations. With complex multiple selections — for example, multiple divisions within a particular region, or specific categories within a product line — this may be a big time-saver. Basically, the user can save his or her prompt answers for later use; instead of selecting or entering the values the next time the user runs the report, he or she can select from a drop-down menu of previously saved prompt answers.
Definitely looking forward to this release! Rumor has it that 9 may be available sooner than later…
Could u plz explain the below topics.
->Users can load prompt answers instead of reanswering every time
->Can edit graphs without going to grid view first. Not hindered by grid layout.